Trunkrs Everything with Wheels
The operations app: collection planning and monitoring, distribution monitoring. Distribution planning is pending and the driver app is not designed yet.
Trunkrs moves parcels across the Netherlands and Belgium, and its day has two halves. Mornings collect: vans go to webshops and bring parcels in. Evenings distribute. Everything with Wheels is the internal app dispatch uses to plan the morning and watch both. The name is literal: anything with wheels is in it.
The problem
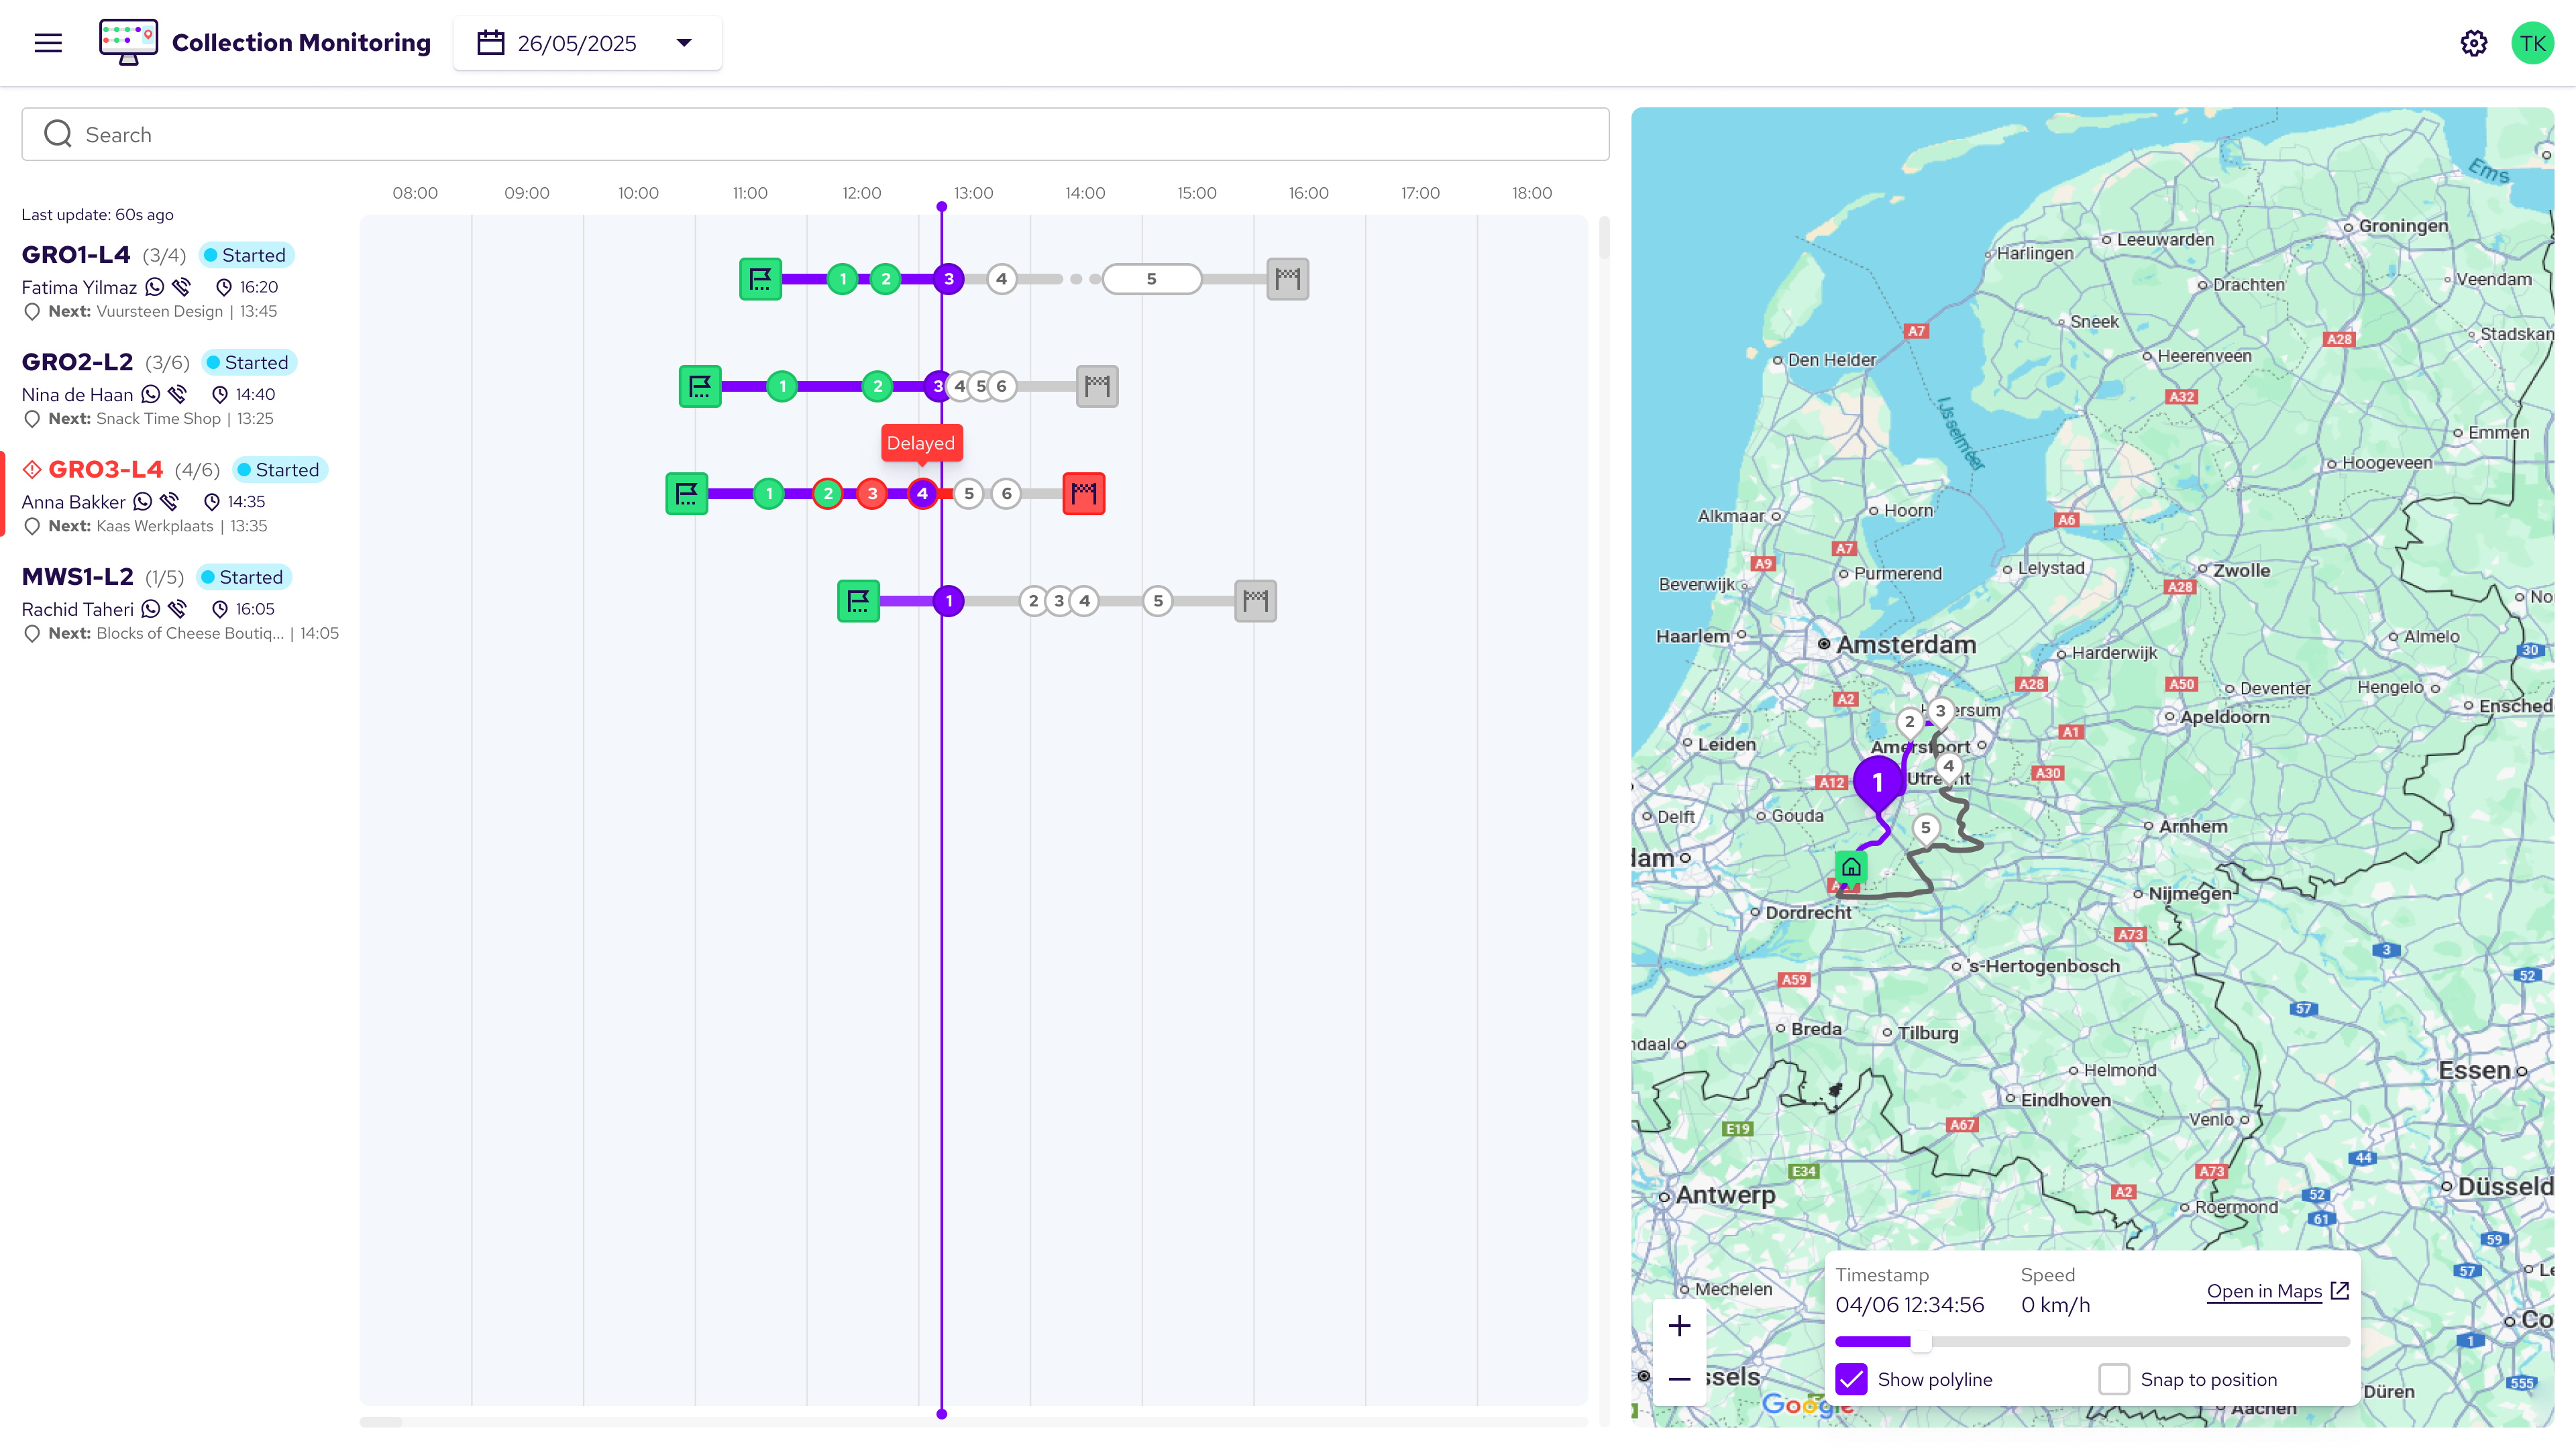
Before this, the evening lived in three places at once. Tour state was tracked across an array of Google Sheets. Anything that needed confirming was confirmed by hand, WhatsApp to the driver and Slack to the subcontractor manager. The numbers underneath came from looking values up in Metabase and Looker, one query at a time. Answering a single question, whether a tour would run late, meant reading a sheet, messaging a person, and running a report, then deciding which of the three to believe.
None of that came from a brief. Dispatchers and planners walked us through their day on screenshare, and recorded real shifts so the work could be watched rather than described.
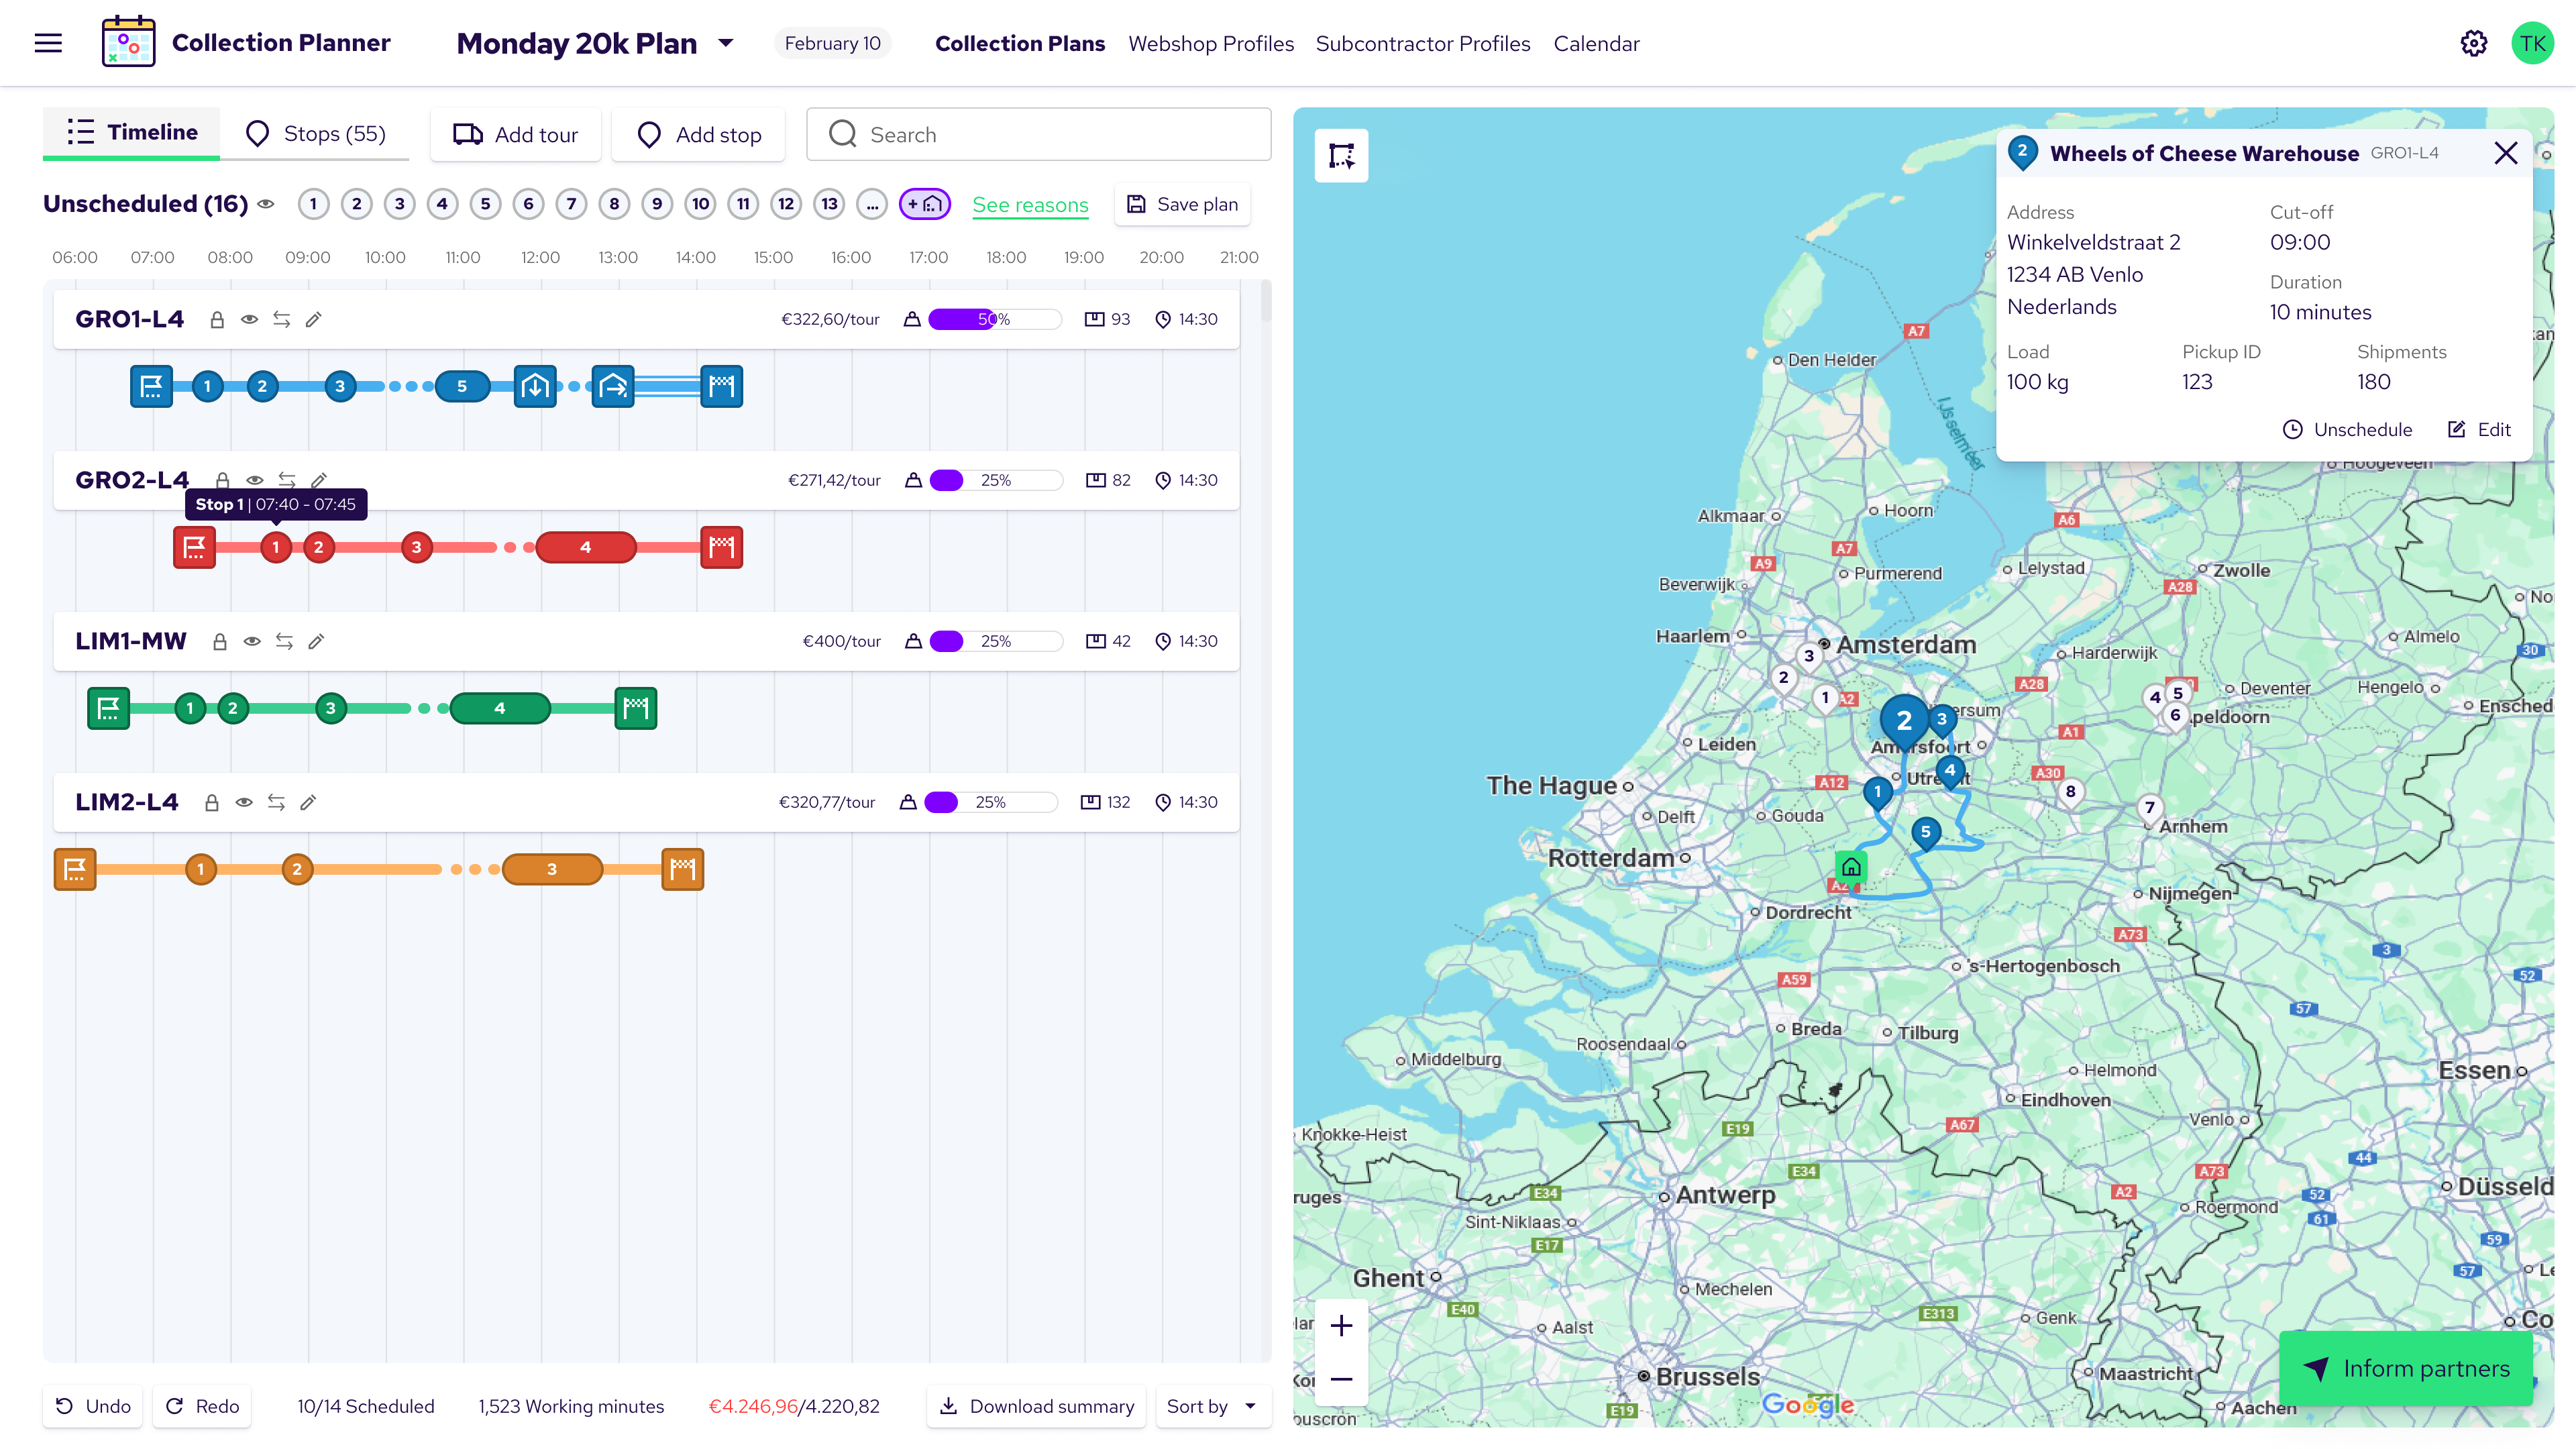
Planning has the same shape of problem earlier in the day. Every webshop has a cut-off and a load, subcontractors have a fixed number of vehicles by type, and the plan carries a budget. Then the day starts and it drifts.
So it is one product across three surfaces rather than a set of separate screens: collection planning, collection monitoring, distribution monitoring. Evening planning is not one of them: it still runs in Planner, the older app these surfaces are taking work from a piece at a time.
Constraints that shaped it
Nothing in the plan is abstract. Tours are named for the vehicle running them, so GRO1-L4 is a
Groningen tour on an L4, and the subcontractor capacity matrix uses the same vehicle types. That
naming runs through every surface: a planner and a dispatcher reading the same string see the same
van.
Decisions worth naming
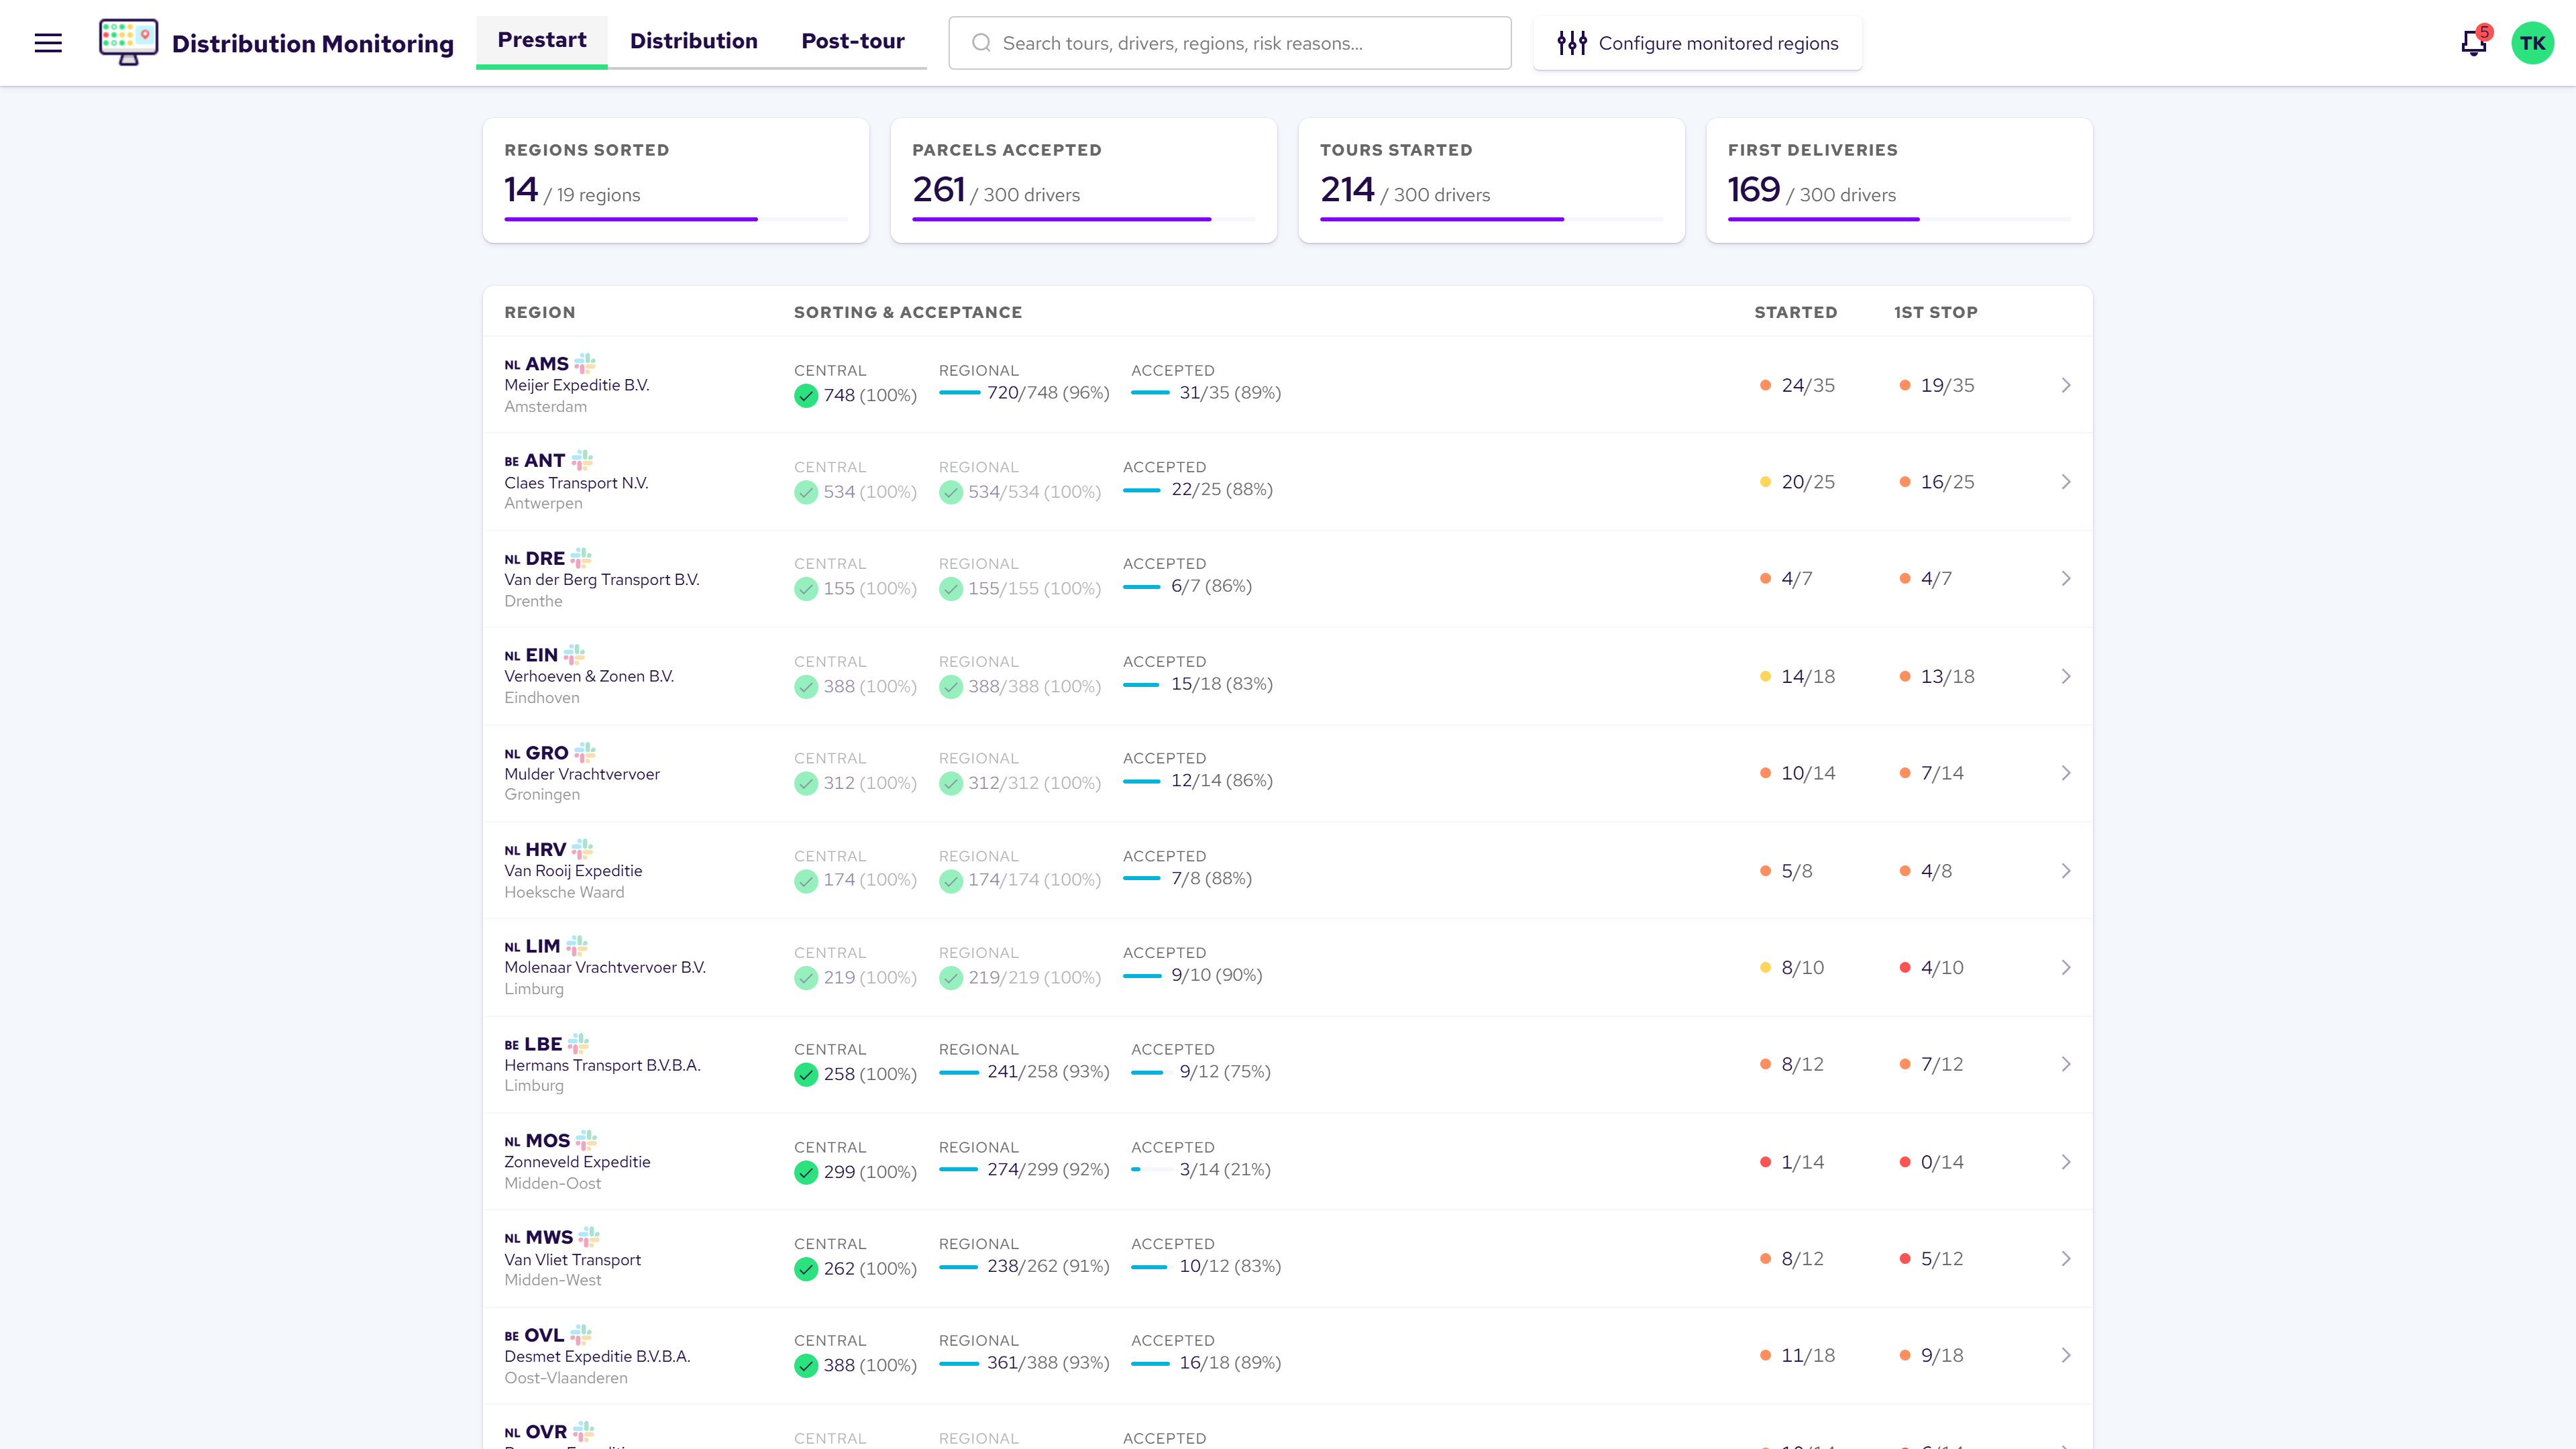
Keep the conversation, remove the lookup. The old workflow was not wrong to involve people. Drivers and subcontractor managers are the ground truth about a street. What made it slow was the hunting around them. So every region row links straight to that region's Slack channel, and every tour card carries Call and Message against its driver. The messaging stays. What goes away is working out who to ask.
Direct manipulation in the plan, not a form. Stops are dragged between tours on the timeline, and a drop zone below them starts a new tour. Right-clicking a stop gives edit, remove, split, assign. Undo and redo sit beside a running total of stops, working minutes, and cost against budget, so a planner can try something and see what it costs.
Splitting a stop distributes load, not parcels. Load is divisible, so a 50kg pickup does not have to ride on one tour. The dialog takes percentages against the pickup's weight and assigns each linked stop to a tour with its own duration and collection time. It also refuses to pretend the arithmetic is finished: at 85% of 50kg it says so, and the confirm stays disabled.
Exceptions are states on the row, not items in a list. A tour at 105% capacity turns red in place and says "Overloaded". A tour that will arrive late turns amber and says "Late arrival". The planner does not go looking for problems; the problems change colour where the planner is already working. Overloading is usually a forecast that was wrong: parcels no longer fit one van and have to move to another, which is what the drag and the split are for. The accuracy grades a merchant sees in the Shipping Portal end up here, as a red row.
Risk is three tiers, because a boolean was flattening two different situations. A driver who is mildly late and habitually catches up is not the same problem as a road accident or a closure that threatens the whole tour, and an at-risk flag said both. Low is worth knowing about, high is worth acting on now, and medium is the honest middle where it depends. The three sort into their own sections, each risk tour carries the reasons that put it there in plain language ("Driver not responding", "Heavy traffic A10 ring"), and promoting a tour opens a modal that asks why before it applies. The tier says how much to care. The reason says what it actually is.
Editing a tour is triage, not repair. When a tour will not finish, the useful question is not which stops to drop but which ones must not be. Frozen and perishable parcels cannot wait a day. Nor can a priority customer, because a bad experience there is a churn risk. So every tour card counts what is still open in exactly those terms, open fresh, open frozen, open priority, and the manage-stops map tags each remaining stop the same way. Dropping a non-critical stop moves it to tomorrow. The mechanic is a route recalculation. The decision it supports is which parcels are allowed to be late.
The distribution day is three modes, not three pages. Pre-start covers depot sorting and acceptance per region, expanding to per-driver rows. Distribution is the live view. Post-tour counts what comes back: parcels to return, and parcels for the freezer.
What shipped, and how
Both monitoring tools are in use internally. I design them as interactive prototypes in production code rather than static mockups, directing AI coding agents to build them, so engineers get something clickable instead of a picture. The distribution prototype runs on the design system's own tokens, which is also how that system gets pressure-tested.
Honest edges
Evening planning still runs in Planner, and the driver app at the end of the chain is a separate app that has been patched along for years to keep it running. I designed neither: my part in Planner is freshening its screens with the design system, and in the driver app a few flows in Figma. Neither gap is hidden, because an operations product that claims to be finished is not describing operations. In the prototype, Call, Message and the Slack links are still placeholders.